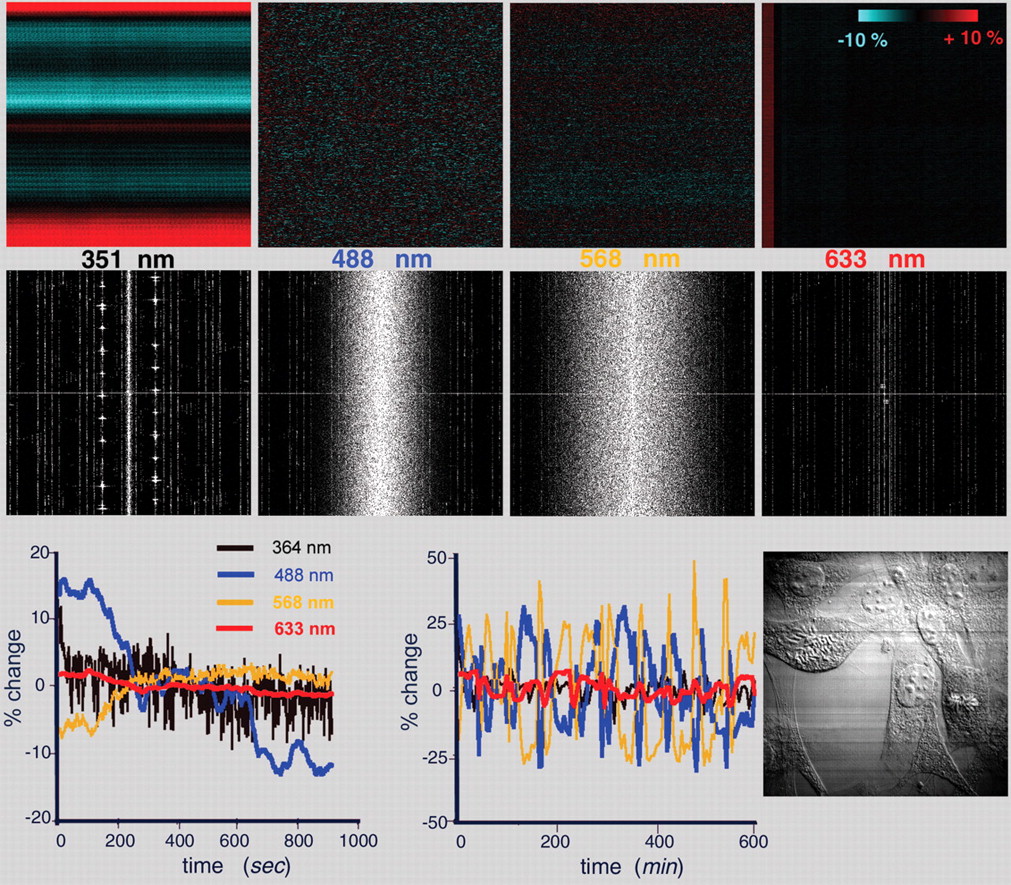
Fluctuations in illumination intensity and polarization in a confocal microscope (Zeiss LSM 510). Mean-corrected images of a uniform specimen (top row) and their power spectra (middle row) acquired with four different laser lines. The experiment was performed under conditions that gave >1000 photons per pixel, and thus the expected single-pixel noise in the images is ∼3%. The images would ideally be of uniform intensity and thus be entirely black after subtraction of the mean value but instead show artifactual intensity fluctuations. Deviations from the mean value of up to ±10% are color coded according to the scale in the top right corner. The power spectra show that each laser contributes patterned noise with a complex mixture of periodicities. Contrast of the power spectra has been enhanced to make the weaker features visible in the print. Some of the patterns have repeat lengths that are much longer than a single scan line. (Bottom row) The average fluctuation in intensity in a 100 × 100-pixel image of a uniform, stable fluorescent sample is plotted for a series of 1000 images acquired at 1-sec intervals (left), or 600 images at 1-min intervals (middle). The expected noise in the average value of 104 pixels is ∼0.03% (i.e., 0 with 8-bit intensity digitization). The effect of these artifacts is to severely degrade the image SNR (see Figs. 22 and 23). The horizontal stripes in the DIC image (bottom row, right) are caused by random changes in plane of polarization that accompany the fluctuations in intensity of the illumination.