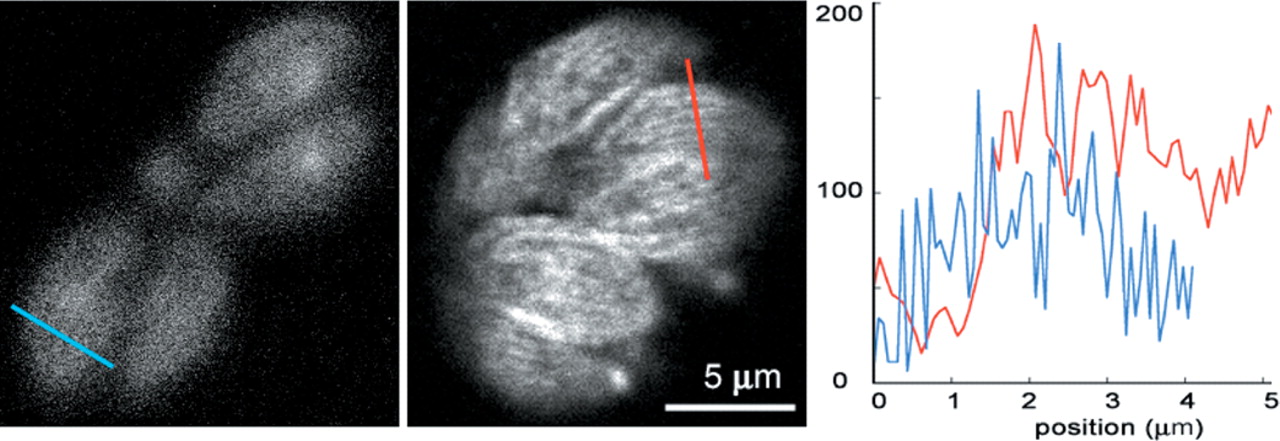
Figure 22.
Spot-scanning confocal images of transgenic Toxoplasma gondii expressing an YFP–α-tubulin fusion protein. Microtubules near the cell surface are included in these single optical sections. (Left) A typical spot-scanning confocal image. (Middle) A superior image (Olympus confocal, much less intensity fluctuation); the best ever recorded from this specimen. Compare the SNR in this image with the wide-field image in Figure 7. (Right) A graph showing the intensity profile along the red and blue lines in the images.