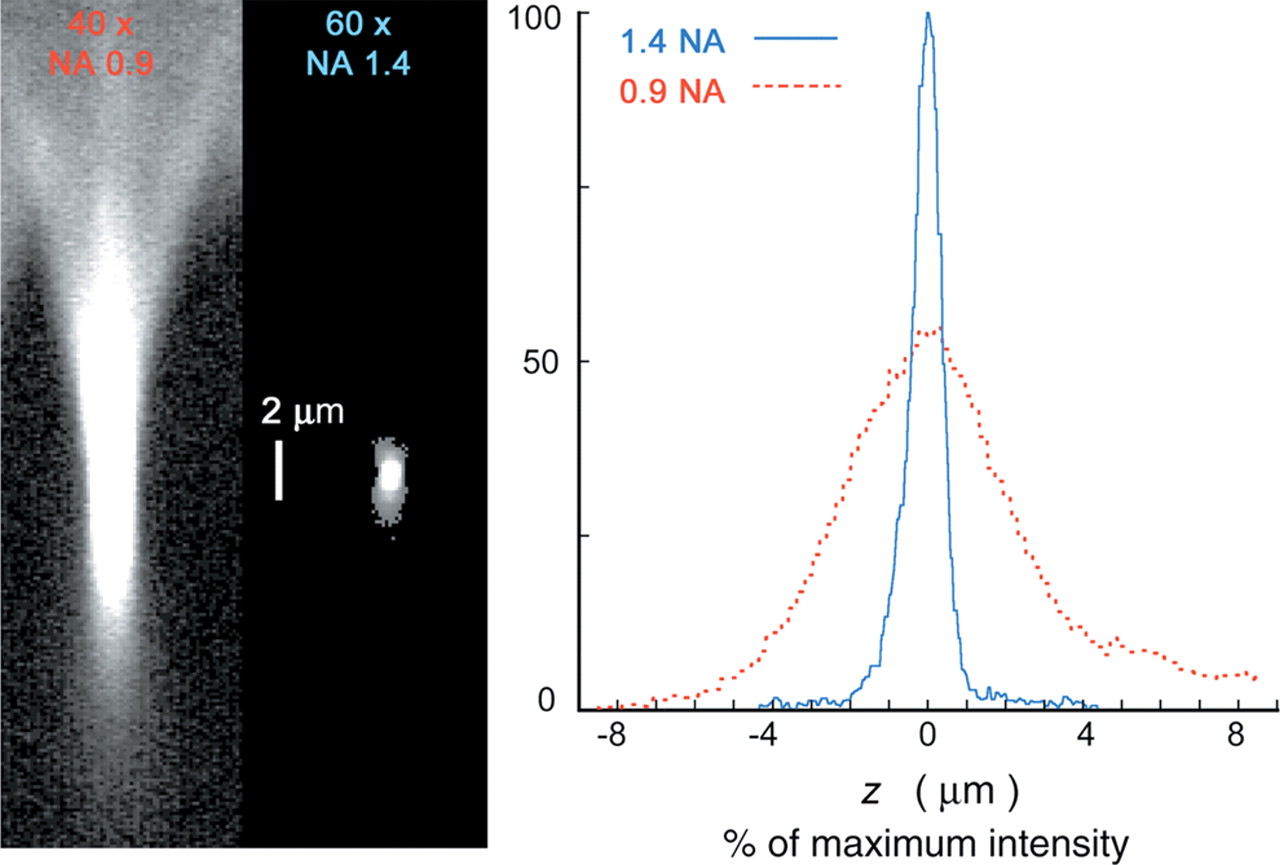
x–z scans of 0.9-µm-diameter fluorescent beads and measured axial intensity profiles. (Left) The left-hand side of the image shows a scan using a 40× (NA = 0.9) objective lens. The right half is a scan of a different sample using a 60× (NA = 1.4) lens. Intensity for the two images has been adjusted to the same maximum value; in reality, the 40× (NA = 0.9) image is much dimmer. The round bead appears to be much more elongated with the lower NA objective for two reasons. Decreasing the NA affects vertical resolution much more severely than lateral resolution. The left scan is also markedly asymmetrical above and below focus, indicative of spherical aberration, which causes further elongation. The right scan (of a different sample) also shows a small amount of spherical aberration. Scale bar, 2 µm. (Right) The graph shows the measured axial intensity profiles for these two situations. In these curves, spherical aberration manifests as asymmetry of the profile to the right and left of the peak (e.g., 40× curve beyond 5 µm).