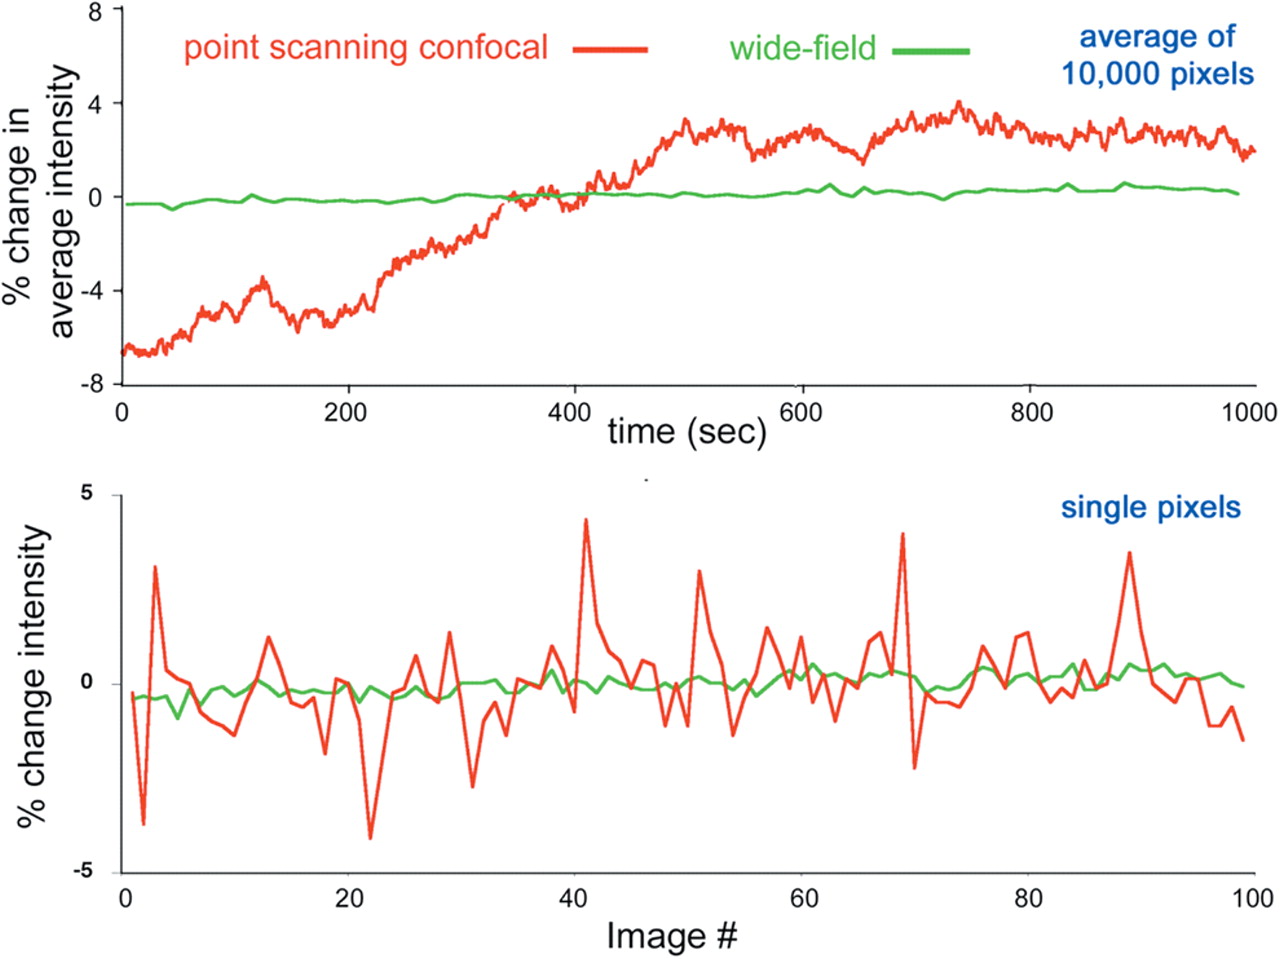
Figure 33.
Fluctuations in illumination intensity in a confocal versus wide-field microscope. (Top) The average intensity in a 100 × 100-pixel image of a uniform, stable, fluorescent sample is plotted for a series of 1000 images acquired at 1-sec intervals, for a point-scanning confocal microscope and a wide-field microscope with a CCD detector. (Bottom) The intensity from a single pixel in a sequence of 100 successive images of the same specimen is plotted.