
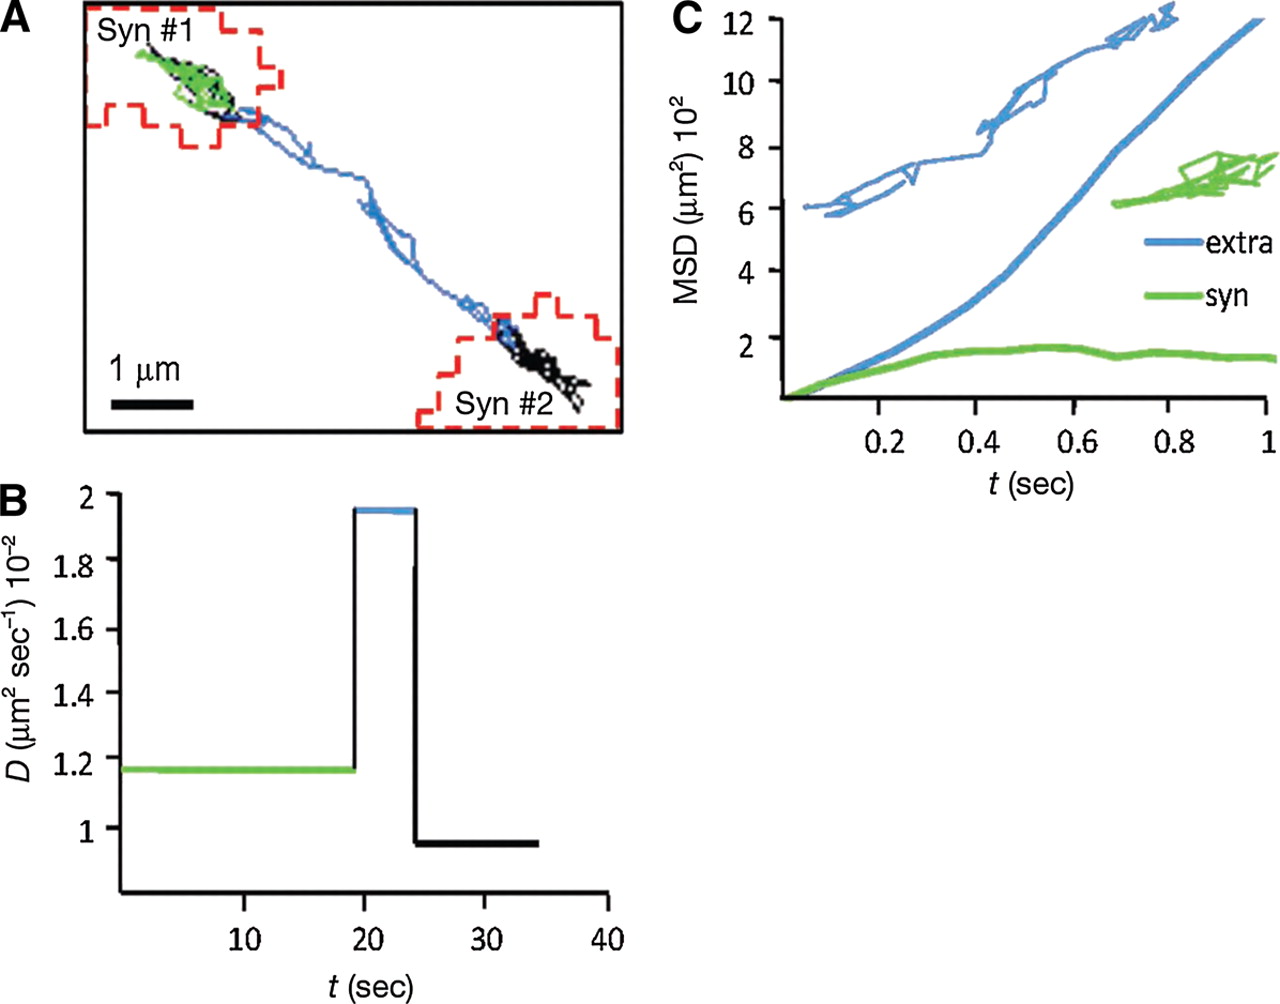
QD trajectory analysis. (A) Example of surface exploration by an itinerant GlyR-QD visualized on a reconstructed trajectory. QD trajectories in synaptic areas #1 (Syn #1, green) and #2 (Syn #2, black); FM4-64-stained synapses (red). Note the large surface area explored by the GlyR-QD outside (blue) the synaptic areas. Scale bar, 1 µm. (B) Average diffusion coefficients of the QD shown in A during its extrasynaptic (blue) and synaptic journey (green and blue). Note the changes in the QD diffusion coefficient when exiting synapse #1 or entering synapse #2, since there is one sudden increase and one drop. (C) Time-averaged MSD function of individual QD shown in A during its exploration of extrasynaptic (blue) and synaptic (green) loci during a recording sequence. The same QD displayed an extrasynaptic linear MSD curve and a synaptic negatively bent MSD curve, characteristic of random walk and confined movement, respectively.


