
Imaging Action Potentials with Calcium Indicators
Adapted from Imaging in Neuroscience (ed. Helmchen and Konnerth). CSHL Press, Cold Spring Harbor, NY, USA, 2011.INTRODUCTION
The understanding of neuronal circuits has been greatly advanced by the ability to simultaneously image action-potential generation within large populations of neurons. This protocol describes bulk loading of brain slices with acetoxymethyl (AM) ester calcium indicators to monitor action-potential activity in functional neuronal circuits. The imaging of calcium influx into neurons provides an indirect but accurate measure of action-potential generation within individual neurons. The key advantage of the technique is that it allows the researcher to densely sample the activity of a large population of neurons with single-cell resolution.
MATERIALS
Reagents
Artificial cerebral spinal fluid (ACSF)
Cortical slices for imaging
Dimethylsulfoxide (DMSO)
Fura-2 AM (Molecular Probes/Invitrogen)
-
Different AM ester calcium indicators under similar experimental conditions have different loading efficacies. Ranked from best loading to worst, in our experience: MagFura-2>Fura-2>Indo-1>Calcium Green-1>Fluo-4>Oregon-Green BAPTA-1>Calcium Orange>Calcium Crimson. Based on our experience, we have also ranked several of the indicators by their efficacy as detectors of action potentials: Fluo-4>Fura-2>MagFura-2. The majority of our experimental procedures use Fura-2 in brain slices. However, the methods described below can be used for any of the listed indicators.
Pluronic F-127, 20% (w/v) in DMSO (Molecular Probes/Invitrogen)
Equipment
Fire-polished pipette, tip diameter ∼30 µm (for Procedure 3)
Imaging setup
-
Both one- and two-photon excitation of calcium indicators can be used to monitor calcium changes in large populations of neurons. Two-photon imaging allows highly sensitive detection of changes in neuronal calcium concentration with relatively little bleaching and photodamage. Epifluorescence imaging of calcium indicators is sufficient to detect changes in neuronal calcium concentration and has the advantage that, using a fast camera, the detection of changes can be of higher temporal resolution than in conventional raster-scanning two-photon systems. However, wide-field fluorescent imaging of bulk-loaded slices is subject to rapid bleaching and is also prone to high background fluorescence. Finally, in our experience, spinning-disk confocals, together with fast cameras, can be used to image thousands of neurons simultaneously, without significant photobleaching and with good signal-to-noise ratios, over long periods of time.
Incubation chamber
Loading chamber
Micromanipulator and patch-clamp electrode holder (for Procedure 3)
Vortex mixer
METHOD
Choose Procedure 1 (Steps 1–3), Procedure 2 (Steps 4–8), or Procedure 3 (Steps 9–15) for loading, depending on the characteristics of the slices to be loaded.
Procedure 1: Loading Embryonic and Neonatal Acute Cortical Slices
-
1. Dissolve 50 µg of Fura-2 AM in 48 µL of DMSO and 2 µL of Pluronic F-127 for a final concentration of 1 mM.
Because the water solubility of calcium AM indicators is poor, vortex the solution for 10–15 min before use.
-
2. Add enough Fura-2 AM solution for a final concentration of 10 µM Fura-2 AM, and load the slices in oxygenated ACSF for 30–60 min.
-
3. Remove slices from the loading chamber, and place into an incubation chamber containing oxygenated ACSF.
Imaging may begin after a 30-min recovery period.
Procedure 2: Loading Juvenile and Adult Acute Cortical Slices
-
4. Dissolve 50 µg of Fura-2 AM in 48 µL of DMSO and 2 µL of Pluronic F-127 for a final concentration of 1 mM.
Because the water solubility of calcium AM indicators is poor, vortex the solution for 10–15 min before use.
-
5. Place slices in the loading chamber containing 2.5 mL of oxygenated ACSF.
-
6. Pipette 5–10 µL of Fura-2 AM solution on top of each slice.
This results in a high initial concentration of Fura-2 AM. The concentration decreases as the Fura-2 AM diffuses away from the site of application, resulting in a final concentration in the entire chamber of ∼10–20 µm.
-
7. Load slices in the dark for 20–30 min at 35°C–37°C with 95% O2/5% CO2 lightly ventilated into the chamber.
As a rule of thumb, the loading time should be 10 min, plus as many minutes as the age of the animal in postnatal days.
-
8. Remove slices from the loading chamber, and place into an incubation chamber containing oxygenated ACSF for wash. The wash occurs through simple diffusion.
Imaging may begin after a 30-min recovery period.
Procedure 3: Pressure Injection
-
Although local neural connections are maintained in the procedure described above (see Kozloski et al. 2001), long axonal projections, such as thalamocortical axons in thalamocortical slice preparations (Agmon and Connors 1991), may be compromised. A modification of Procedure 1 can be used to circumvent this problem (MacLean et al. 2005). The pressure injection of AM indicators is also used in Stosiek et al. (2003).
-
9. Dissolve 50 µg of Fura-2 AM in 13 µL of DMSO and 2 µL of Pluronic F-127, achieving a final concentration of 3.3 mm. Vortex the solution for 10–15 min.
-
10. Deposit the slices into the first loading chamber containing 2 mL of ACSF ventilated with 95% O2/5% CO2, and place onto the microscope stage.
-
11. Fill a fire-polished pipette (tip diameter ∼30 µm) with 7.5 µL of Fura-2 AM.
-
12. Insert the filled pipette into a standard patch-clamp electrode holder, with tubing attached, and, using a micromanipulator, place the pipette tip 100–200 µm above the surface of the slice. Apply 5–10 psi positive pressure to the pipette. Slowly (1–2 µL in 1 min) move the pipette across the surface of the slice using the manipulator, covering the area of interest with the dissolved Fura-2 AM.
-
13. Move the slices to the second loading chamber containing 2.5 mL of ACSF and the remaining 7.5 µL of Fura-2 AM.
-
14. Load the slices in the dark for 20–30 min (as a rule of thumb, 10 min plus the age of the animal in days) at 35°C–37°C with 95% O2/5% CO2 lightly ventilated into the chamber.
-
15. Remove the slices from the loading chamber and transfer them to an incubation chamber containing oxygenated ACSF for washing.
Imaging may begin after a 30-min recovery period.
DISCUSSION
Example of Application
Figure 1 illustrates two-photon imaging of Fura-2 as an indicator of neuronal spiking activity. Figure 1A illustrates several thousand loaded neurons in a neocortical slice imaged using a two-photon microscope. Figure 1B reveals the correlation between neuronal activity and a change in fluorescence as detected by epifluorescence. The fluorescence of Fura-2 decreases in the presence of calcium; thus, the negative fluorescent change in Figure 1B ii. As illustrated, even one-photon imaging of Fura-2 is sufficient to detect and to resolve action-potential generation in a single neuron within a field of loaded cells. Because of the rapid time course for the onset of its response, Fura-2 lends itself to the elucidation of network dynamics when simultaneously imaging large populations of neurons.
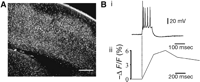
High-resolution calcium imaging of neuronal activity. (A) Two-photon image of transverse section of mouse neocortex loaded with Fura-2 AM. Scale bar, 250 μm. Note that thousands of neurons can be adequately visualized. (B) Correspondence between action potentials and somatic fluorescence change. (i) Whole-cell recording of a burst of action potentials in response to a single intracellular depolarizing current step (150 pA, 200 msec). (ii) Normalized fluorescence change for the recorded neuron imaged with a cooled charge-coupled device (CCD) camera (Micromax, Princeton Instruments). The recording pipette contained 50 µm of Fura pentapotassium salt (comparable to the intracellular concentration of Fura following bulk loading). Although individual action potentials cannot be resolved, the onset of neuronal activity is accurately imaged.
Inferring Spikes from Calcium Imaging
Given fluorescence traces from imaged neurons, such as those in Figure 1, we would like to be able to infer the underlying spike trains. This is a difficult statistical problem for a number of reasons, including the low temporal resolution of the imaging (often <30 Hz) and, in some cases, the limited signal-to-noise ratio of the fluorescence observations (e.g., caused by indicator saturation). A number of groups have devised algorithms for extracting spiking activity from fluorescence observations, including thresholding (Mao et al. 2001), template matching (Kerr et al. 2005), linear deconvolution (Yaksi and Friedrich 2006; Holekamp et al. 2008), support vector methods (Sasaki et al. 2008), nonlinear Bayesian deconvolution via sequential Monte Carlo (particle filtering) (Vogelstein et al. 2009), and fast non-negatively constrained optimization methods (Vogelstein et al. 2010). Most of these approaches either explicitly or implicitly assume a model relating the spike trains to the fluorescence observations: The spike train is convolved with some linear filter (usually a simple exponential filter, although this may be generalized) to obtain the intracellular calcium concentration, and the fluorescence signal is essentially a noisy, possibly saturated version of the calcium. The parameters of this model may be estimated via standard statistical time-series methods if simultaneous observations of electrophysiological and imaging data are available or via the expectation-maximization algorithm if only imaging data are available (Vogelstein et al. 2009). These latter approaches have been shown to perform well in a variety of experimental preparations, including both in vitro and in vivo data sets (see Fig. 2 for an in vitro example).
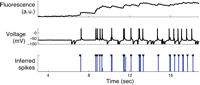
Automatic detection of action potentials. The fluorescence trace (top) was recorded from a pyramidal cell in the somatosensory cortex from a P14 mouse using Fura-2 (see Vogelstein et al. 2009 for more details). The true spike times were ascertained using simultaneous electrophysiological methods (middle). A nonlinear Bayesian deconvolution algorithm provides the probability of a spike occurring in each time bin (bottom), given the fluorescence observations. Although this fluorescence trace is highly saturated, this nonlinear approach performs well. Note that the parameters were estimated using only the observed fluorescence trace; that is, the electrophysiological data were not used to train the algorithm.
Advantages and Limitations
The use of calcium AM ester indicators provides a very robust method of imaging activity in large populations of neurons simultaneously. In our experience, bulk application of voltage-sensitive fluorescence or second-harmonic voltage-sensitive dyes does not enable the detection of activity in an individual cell within a population of neurons, such as a cortical slice. Their nonspecific staining pattern and poor signal strength currently make optical recording with single-cell resolution unfeasible in cortical slices (Yuste et al. 1997). On the other hand, calcium indicators (Tsien 1989) that can be bulk loaded into brain slices using their AM ester derivatives (Yuste and Katz 1991) act as very good, albeit indirect, measures of action-potential generation (Smetters et al. 1999). These still provide the best means of imaging activity in large populations of neurons when single-cell resolution is desirable.
The limitations of the technique are due to the properties of the dyes themselves. Calcium indicators, being charged molecules, do not easily cross the cell membrane and need, therefore, to be microinjected. To circumvent this problem, AM ester derivatives of the indicators were synthesized (Tsien 1981). The AM esters mask negative charges, making the indicator molecules more lipophilic and membrane permeant, thus allowing them to enter the cell. Once inside the cell, cytoplasmic esterases hydrolyze the acetyl ester linkage, releasing formaldehyde and free indicator, which then accumulates intracellularly as it is once again charged. However, the dependence on intracellular enzymatic cleavage makes this process cell dependent. This can result in differential loading efficiency in different neurons. In addition, the increased hydrophobicity of the AM ester derivatives of the indicators can cause problems in delivering sufficient amounts to their targets. This problem becomes significant in adult preparations or in vivo, in which the pressure injection method appears to be the best loading strategy. Finally, because calcium dynamics are slower than action potentials and because the calcium signal can become saturated with increasing numbers of spikes, advanced quantitative approaches, as described above, are necessary to deconvolve the fluorescence change into the underlying spike train. Although significant advances have been made in this regard (see Vogelstein et al. 2009, 2010), continued improvement appears necessary.
- © 2011 Cold Spring Harbor Laboratory Press


