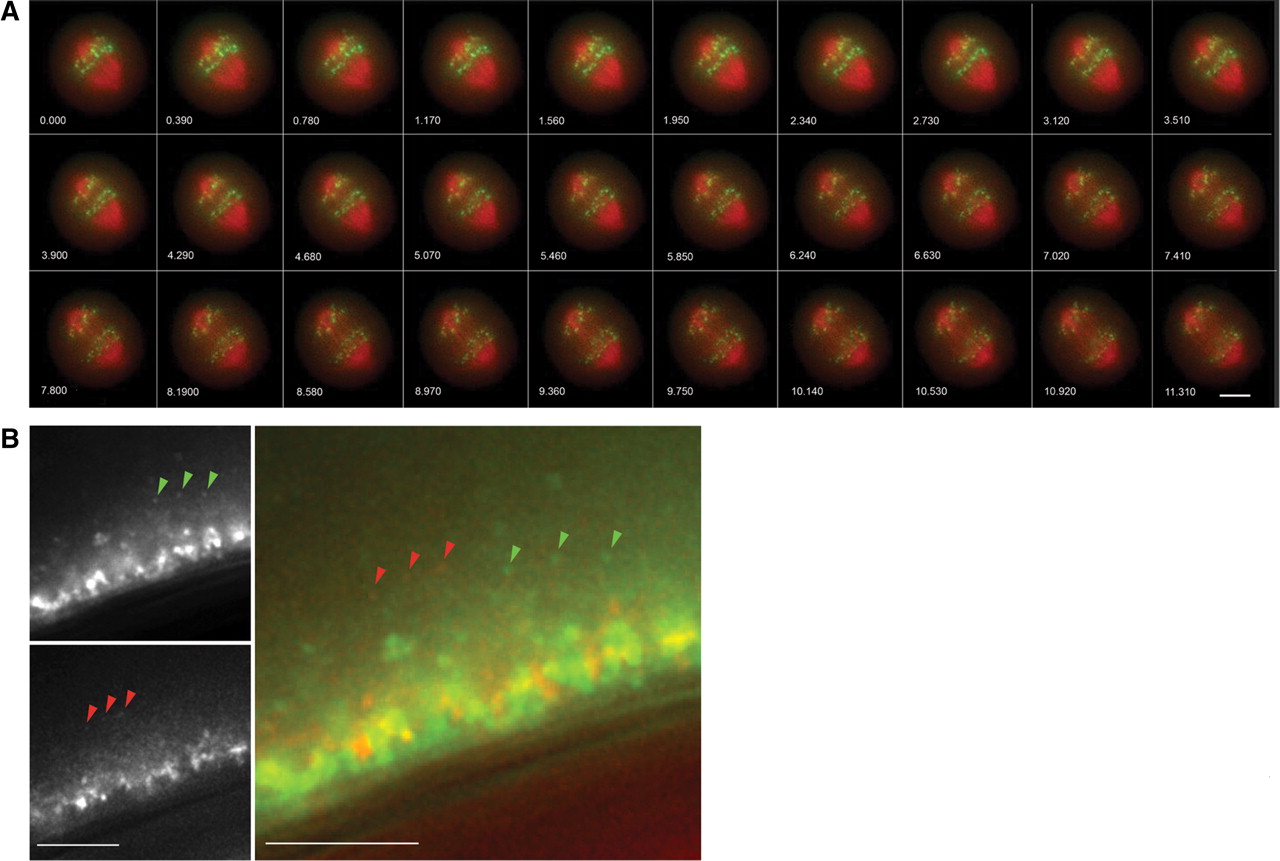
Live cell imaging with OMX. (A) A mitotic HeLa cell with mCherry-labeled tubulin and GFPCenpB (three z sections, 0.5 μm apart, time lapse 390 msec). Images have been deconvolved, and maximum intensity projected. (B) Drosophila oocytes with Swa-GFP and bcd*RFP (bcd-RNA labeled with mRFP via the MS2 system) (Weil et al. 2006). Images show GFP (upper left), red fluorescent protein (RFP) (lower left), and color merge (right). Arrowheads point to moving particles; clearly the two sets of particles move separately. In both A and B, wavelengths were acquired simultaneously on OMX v2 and then aligned and fused. Numbers indicate elapsed time in seconds. Scale bars, 5 μm. (A Reprinted with permission from Emma King and Markus Posch, University of Dundee, and Paul Goodwin, API. B Reprinted with permission from Timothy Weil and Richard Parton, University of Oxford.)