
Techniques for the Detection of Autophagy in Primary Mammalian Cells
- Daniel Puleston1,
- Kanchan Phadwal2,
- Alexander Scarth Watson2,
- Elizabeth J. Soilleux3,
- Suganthi Chittaranjan4,
- Svetlana Bortnik4,
- Sharon M. Gorski5,
- Nicholas Ktistakis6 and
- Anna Katharina Simon1,7,8
- 1MRC Human Immunology Unit, Weatherall Institute of Molecular Medicine, John Radcliffe Hospital, Oxford OX3 9DS, United Kingdom;
- 2BRC Translational Immunology Lab, Nuffield Department of Medicine, Oxford University, Oxford OX3 9DS, United Kingdom;
- 3Nuffield Department of Clinical Laboratory Sciences, Oxford OX3 9DS, United Kingdom;
- 4The Genome Sciences Centre, BC Cancer Agency, Vancouver V5Z 1L3, Canada;
- 5Department of Molecular Biology and Biochemistry, Simon Fraser University, Burnaby V5A 1S6, Canada;
- 6Babraham Institute, Cambridge CB22 3AT, United Kingdom;
- 7BRC Translational Immunology Lab, Oxford University, Oxford OX3 9DS, United Kingdom
Abstract
Autophagy is a lysosomal catabolic pathway responsible for the degradation of cytoplasmic constituents. Autophagy is primarily a survival pathway for recycling cellular material in times of nutrient starvation, and in response to hypoxia, endoplasmic reticulum stress, and other stresses, regulated through the mammalian target of rapamycin pathway. The proteasomal pathway is responsible for degradation of proteins, whereas autophagy can degrade cytoplasmic material in bulk, including whole organelles such as mitochondria (mitophagy), bacteria (xenophagy), or lipids (lipophagy). Although signs of autophagy can be present during cell death, it remains controversial whether autophagy can execute cell death in vivo. Here, we will introduce protocols for detecting autophagy in mammalian primary cells by using western blots, immunofluorescence, immunohistochemistry, flow cytometry, and imaging flow cytometry.
Introduction
There are three main types of autophagy: chaperone-mediated autophagy, microautophagy, and macroautophagy (Mizushima and Komatsu 2011). The accompanying protocols detect processes related to macroautophagy, referred to as autophagy hereafter.
Over 32 related proteins have been identified that mediate the completion of the double-membraned autophagosome before fusion to the lysosome and degradation of its contents (see Fig. 1 for an overview). The formation of the autophagosome is initiated by a protein complex, which includes Ulk1 (Atg1) and Atg13, that in mammals can only be activated in the absence of signaling from the nutrient-sensing kinase mammalian target of rapamycin (mTOR). Also key to autophagosome development in humans are the class III phosphoinositide 3-kinases Vps34 and Vps35, which along with Beclin-1 (human homolog of Atg6) mediate the “nucleation” step. Elongation of the isolation membrane is mediated by two ubiquitin-like conjugation systems that are key to the autophagosome expansion: one system where Atg7 (an E1-like protein) and Atg10 (E2-like) act to conjugate Atg5–Atg12, and another where the Atg5–Atg12 conjugate (an E3-like protein) acts in concert with Atg7 and Atg3 (E2-like) to conjugate Atg8 to phosphatidylethanolamine (so-called “lipidation” of LC3) for insertion into the membranes of the growing autophagosome (Mizushima and Komatsu 2011).
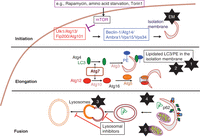
Overview of the autophagy pathway, its key molecular players and protocols. The numbered star symbols relate to the accompanying protocols; “EM” refers to electron microscopy (not described), which can detect double-membrane vesicles. Protocols 1 and 2 detect lipidated LC3; Protocol 3 quantifies the fusion of lysosomes with autophagosomes; Protocol 4 detects the presence of nondegraded adaptor protein p62 on tissue sections, an indication of reduced levels of autophagy; and Protocol 5 measures mitochondrial damage, a consequence of reduced autophagy. Abbreviation: PE, phosphatidylethanolamine. (1) Protocol: Monitoring Autophagic Flux by Using Lysosomal Inhibitors and Western Blotting of Endogenous MAP1LC3B (Chittaranjan et al. 2015); (2) Protocol: Monitoring the Localization of MAP1LC3B by Indirect Immunofluorescence (Ktistakis 2015); (3) Protocol: Analyzing the Colocalization of MAP1LC3 and Lysosomal Markers in Primary Cells (Phadwal 2015); (4) Protocol: Detection of p62 on Paraffin Sections by Immunohistochemistry (Watson and Soilleux 2015); (5) Protocol: Detection of Mitochondrial Mass, Damage, and Reactive Oxygen Species by Flow Cytometry (Puleston 2015).
DETECTION OF AUTOPHAGY DEPENDENT ON LC3
In mammals, eight members of the Atg8 family have been identified. The best-known member of the family is LC3 (MAP1LC3A or MAP1LC3B), which is a key molecule in the majority of “classical” autophagy-detection assays and can be detected in its endogenous form in primary cells. The lipidation of LC3 causes LC3 (LC3-II) to run faster than its nonlipidated form (LC3-I) in a western blot (see Protocol: Monitoring Autophagic Flux by Using Lysosomal Inhibitors and Western Blotting of Endogenous MAP1LC3B [Chittaranjan et al. 2015]). LC3-I is uniformly distributed in the cell when autophagy levels are low, whereas, upon induction of autophagy, lipidation of LC3 causes its relocalization to the autophagosome, which can be visualized and quantified by counting LC3 spots through using immunofluorescence microscopy (see Protocol: Monitoring the Localization of MAP1LC3B by Indirect Immunofluorescence [Ktistakis 2015]). The third “classical” technique is the visualization of double-membrane vesicles by standard electron microscopy. Although this technique is not elaborated here, the reader is referred to excellent reviews elsewhere on this method (Eskelinen 2008).
However, there are caveats to all three techniques when applied to primary cells: detecting autophagy in one cell type among a mixture of primary cells (different cell types have different levels of autophagy) require cell sorting. Similar to other cellular stresses, sorting with magnetic beads or by flow cytometry can induce autophagy, thereby making it difficult to show a further induction. Protocol: Analyzing the Colocalization of MAP1LC3 and Lysosomal Markers in Primary Cells (Phadwal 2015) avoids sorting by simultaneously identifying cell types and measuring autophagy using the ImageStream, which is an imaging cytometer. With the ImageStream, it is possible to quantify either endogenous LC3 puncta or LC3–GFP puncta while detecting surface markers. LC3 puncta can also be colocalized with a lysosomal dye or antibody to detect autolysosomes. Note that commercially available kits have recently been developed for detecting autophagy that can be used with conventional flow cytometers (see Protocol: Analyzing the Colocalization of MAP1LC3 and Lysosomal Markers in Primary Cells [Phadwal 2015] for details).
INHIBITORS AND INDUCERS
The three protocols mentioned above require the addition of lysosomal inhibitors to stop the autophagic flux and thereby allow the accumulation of autophagosomes or autolysosomes to be detected. We present examples of bafilomycin A and chloroquine, both inhibiting the fusion of the autophagosome with the lysosome. We also use the inhibitors E64d and pepstatin, which inhibit lysosomal proteases that are responsible for the degradation of proteins that occurs within lysosomes. For the induction of autophagy, we have used 1 or 2 h of starvation (amino acid deprivation) or drugs such as rapamycin and Torin 1 (ATP competitive inhibitor of mTOR). The initiation of autophagy can be inhibited by wortmannin, an inhibitor of phosphoinositide 3-kinases. As a cautionary note, it is important to bear in mind that many of these compounds do not exclusively target the autophagic pathway.
OTHER METHODS FOR DETECTING THE CONSEQUENCES OF THE MODULATION OF AUTOPHAGY FOR TISSUES AND FOR PRIMARY CELLS BY FLOW CYTOMETRY
As described elsewhere (see Protocol: Monitoring Autophagic Flux Using Ref(2)P, the Drosophila p62 Ortholog [DeVorkin and Gorski 2014]), p62 (Sequestosome-1) is an adaptor protein that targets the ubiquitylated cargo to the LC3-decorated autophagosome by means of its LC3-binding domain. When autophagic flux is arrested, p62 accumulates. This can be used to assess the levels of autophagy in tissue sections, both paraffin embedded and frozen (see Protocol: Detection of p62 on Paraffin Sections by Immunohistochemistry [Watson and Soilleux 2015]). Note that an increase p62 mRNA can cause the accumulation of p62 protein and should be measured, if possible, concomitantly.
Decreases in the levels of autophagy are often accompanied by reduced mitophagy, leading to the accumulation of damaged mitochondria and reactive oxygen species (ROS). Traditionally, these have been detected by immunofluorescence by using fluorescent probes. We present a protocol that simultaneously quantifies mitochondrial damage or ROS, and surface markers, by flow cytometry using the same probes (see Protocol: Detection of Mitochondrial Mass, Damage and Reactive Oxygen Species by Flow Cytometry [Puleston 2015]).
DIFFERENCES BETWEEN PRIMARY AND TRANSFORMED CELLS
Primary cells typically have high basal levels of autophagy and show a much reduced level of increase in autophagy (e.g., in response to starvation) compared with that of cell lines. Each cell type will require a different stimulus for the induction of autophagy. Moreover, the levels of autophagy differ between cell types, even related ones such as B and T lymphocytes. Additionally, as expected, a large variation in autophagy between different healthy donors can be observed. As autophagy can be induced by many stimuli, including starvation, exercise, and circadian rhythm, even the timing of tissue donation needs to be considered. For knockdown experiments, although the key autophagy machinery and its molecules most probably remain the same, adaptor molecules can differ between cell types. Transformed cell lines often carry monoallelic deletions that encompass autophagy genes, so knockdown of those particular genes can be very efficient. This obviously does not apply to primary cell lines.
Finally, note that the autophagy research community has contributed to a comprehensive publication of guidelines for the detection of autophagy (Klionsky et al. 2008), with an update planned for 2015, as well as a useful glossary (Klionsky et al. 2011).
ACKNOWLEDGMENTS
We thank the National Institute for Health Research/Biomedical Research Centre Oxford for funding A.K.S. and K.P., the Wellcome Trust for funding D.P., and the Lady Tata Memorial Trust and Natural Sciences and Engineering Research Council of Canada for supporting A.S.W.
- © 2015 Cold Spring Harbor Laboratory Press


