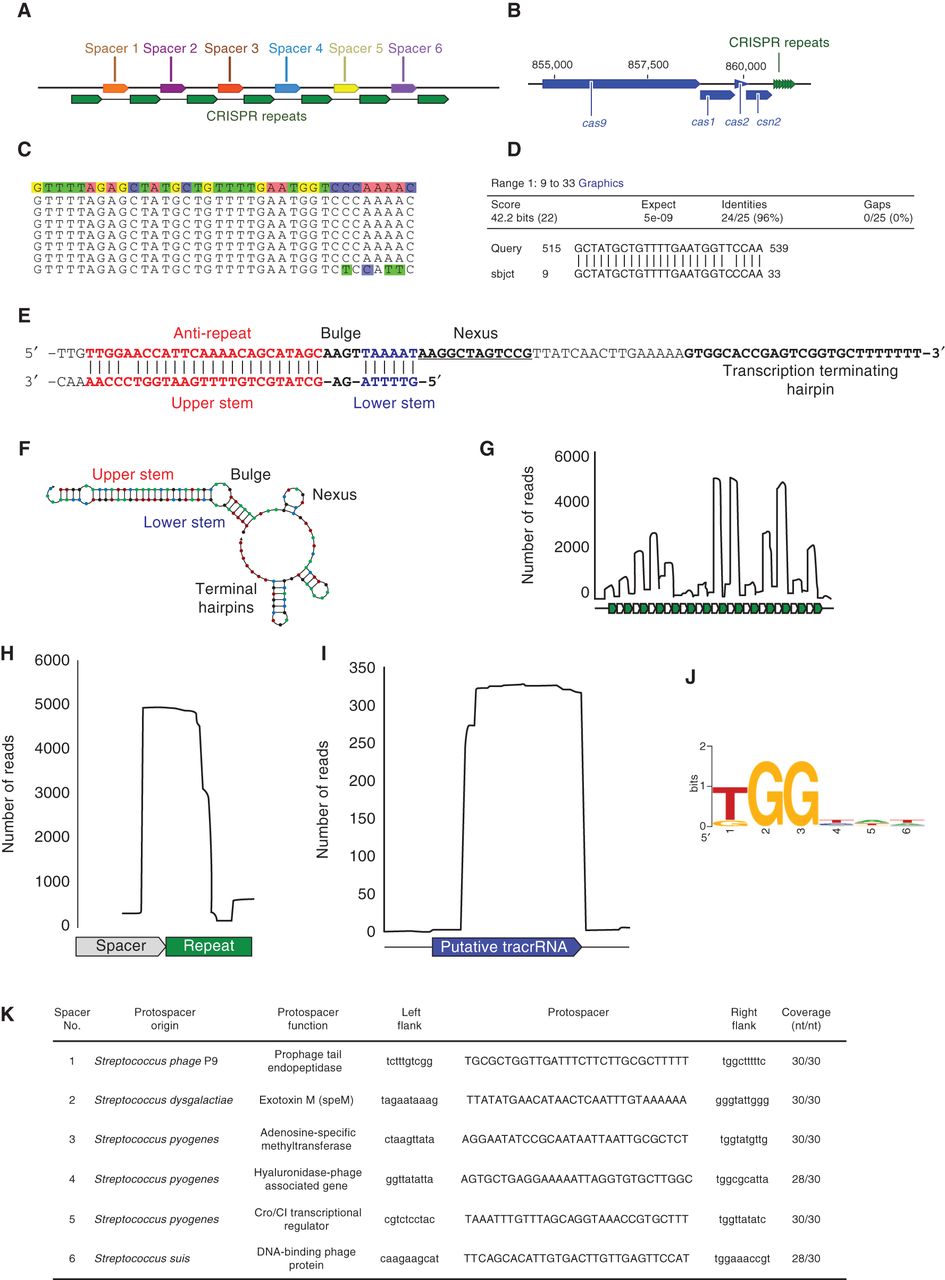
Annotation and validation of Type II CRISPR–Cas9 system elements. (A) Visualization output (in the Geneious7 graphical user interface) of the CRISPR Recognition Tool (CRT) (Bland et al. 2007), which is used to identify CRISPR repeats and spacers. Variable spacers (colored arrows) are flanked by conserved CRISPR repeats (green arrows). (B) Identification and confirmation of cas genes adjacent to the CRISPR repeat-spacer array. Predicted cas genes should be confirmed using NCBI’s BLAST or CDD to ensure correct annotation of the locus. (C) The terminal repeat often contains nucleotide mutations that can be used to determine the directionality of the CRISPR array. The consensus CRISPR repeat sequence is shown on the top line highlighted in colored boxes. The final CRISPR repeat has four mutated nucleotides at the 3′ end (highlighted); thus, it is likely to be the terminal repeat. (D) The alignment output from BLAST local alignment identifies the antirepeat portion of the tracrRNA that forms the upper stem (Briner et al. 2014). The antirepeat covers 1/5 to 2/3 of the entire repeat sequence. The “Query” sequence is the genomic region upstream of the cas9 gene in Streptococcus pyogenes. The “sbjct” (Subject) sequence is the consensus CRISPR repeat sequence from Streptococcus pyogenes. The antirepeat detected by the local alignment had 96% identity to a 25-nt stretch of the CRISPR repeat with zero gaps. (E) The tracrRNA in the CRISPR locus is identified by locating the antirepeat segment from the local alignment. The antirepeat forms the upper stem (red) portion of the crRNA:tracrRNA duplex. Extending through the CRISPR repeat, there are several unpaired nucleotides that form the bulge (bold), followed by reestablished complementarity to form the lower stem module (blue). Adjacent to the lower stem is the nexus module (underlined) that forms a small hairpin structure in the RNA secondary structure prediction (Briner et al. 2014). (F) The predicted tracrRNA search is extended through a Rho-independent transcriptional terminator, such as the final bolded nucleotides in the Streptococcus pyogenes tracrRNA sequence. The RNA structure prediction from NUPACK (Zadeh et al. 2011) contains the five functional modules formed when the crRNA and tracrRNA form a duplex molecule (Briner et al. 2014). (G) RNA sequencing reads that map to the CRISPR repeat-spacer array can be used to determine the processing boundaries for the crRNAs. The conserved repeats (green arrows) flank variable spacer sequences (gray arrows). The crRNAs can be some of the most highly transcribed small RNAs in the cell. (H) The 5′ boundary of the crRNA will be in the spacer sequence as a result of cellular nuclease activity. The 3′ boundary of the crRNA in the CRISPR repeat is matured by RNase III processing activity when the pre-crRNA is complexed with the tracrRNA (Deltcheva et al. 2011; Karvelis et al. 2013). (I) The predicted tracrRNA can be confirmed through RNA sequencing analyses. The 5′ end of the tracrRNA is matured by RNase III activity when the tracrRNA is interacting with the pre-crRNA. The 3′ end of tracrRNA either is the transcript terminator or is processed by cellular nucleases. The predicted tracrRNA is often longer than the RNA sequencing-confirmed tracrRNA, as the predicted sequence contains a portion that is removed during crRNA biogenesis (Deltcheva et al. 2011; Karvelis et al. 2013). (J) A motif detection program, like WebLogo (Crooks et al. 2004), is used to identify the conserved PAM in the region downstream from the protospacer. The height of each nucleotide correlates to its conservation at each position. (K) The table of protospacer hits shows that the spacer sequences match phage and streptococci sequences in publicly available data. The best matches (>90% identity over the entire spacer sequence) can be used to extract flanking regions and predict the PAM.