
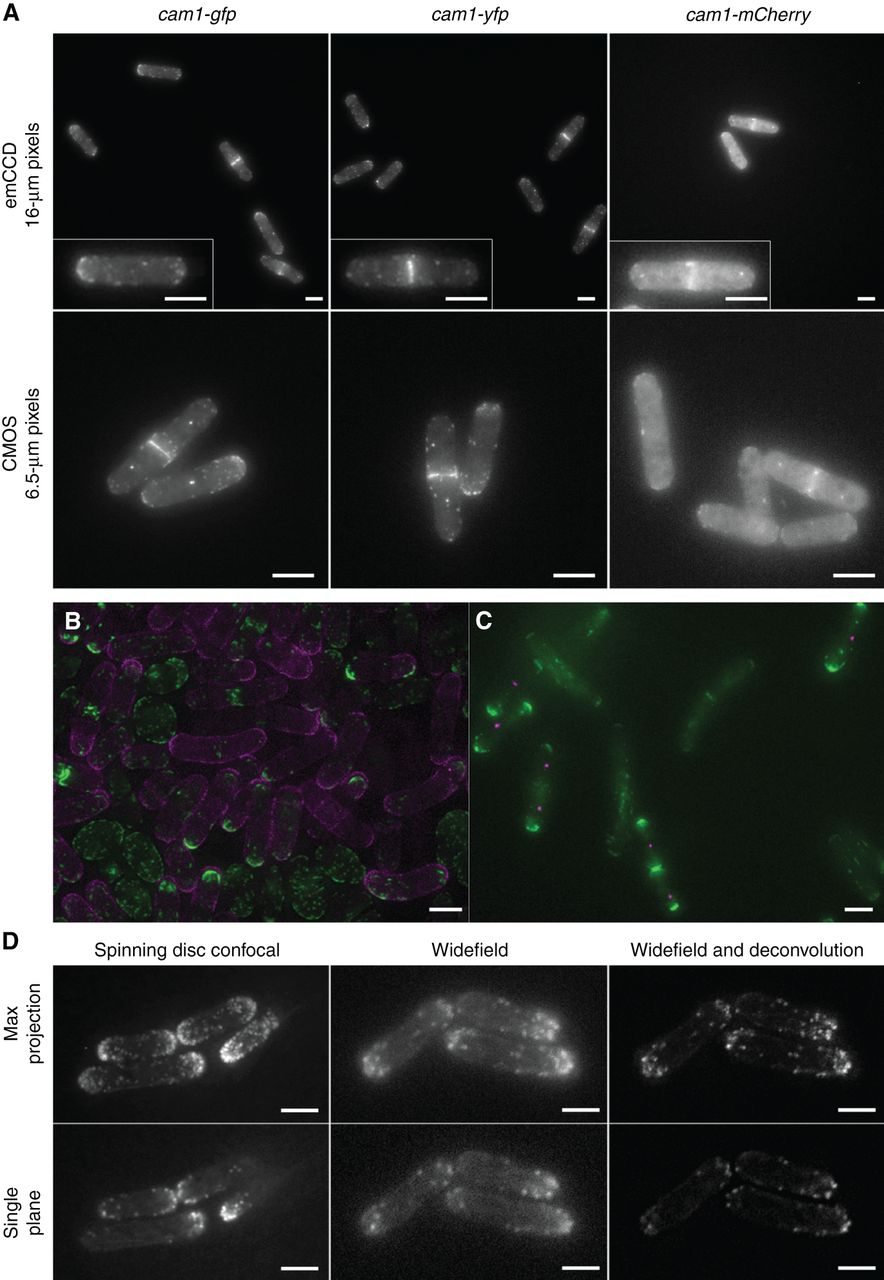
Approaches to imaging. (A) Comparison of fission yeast calmodulin–FP fusion strains and camera chips. Maximum projections from 21 z-plane images of cam1-gfp (left panels), cam1-yfp (center panels), and cam1-mCherry (right panels) cells. Images were captured with either an emCCD (upper panels) or CMOS (lower panels) camera, each using 1× binning. Light intensity, filters, and exposure times are comparable between cameras. Images were captured with 50-msec exposure times for GFP and yellow fluorescent protein (YFP), whereas mCherry images were captured with a 100-msec exposure. (B,C) Two approaches for differentially labeling strains to support direct comparison of phenotypes, localization patterns, and signal intensity under identical imaging conditions in the same field of view. (B) orb2+ and orb2-24 cells, each overexpressing a GFP–Myo1 fusion (green) at 36°C. orb2+ cells were transiently resuspended in TRITC-labeled lectin solution (magenta) before mounting alongside unlabeled wild-type cells. (C) A mixed mounting of tea1-gfp sid4-tdTomato and tea1-gfp tea2Δ cells. tea2+ sid4-tdTomato cells (magenta spindle pole bodies) have strong Tea1–GFP signal (green) at the cell poles whereas the signal intensity is markedly reduced in the tea2Δ cells whose spindle pole bodies are unlabeled. (D) Lifeact-expressing cells imaged on the indicated systems with images captured and processed as indicated. Scale bars: 5 µm.


