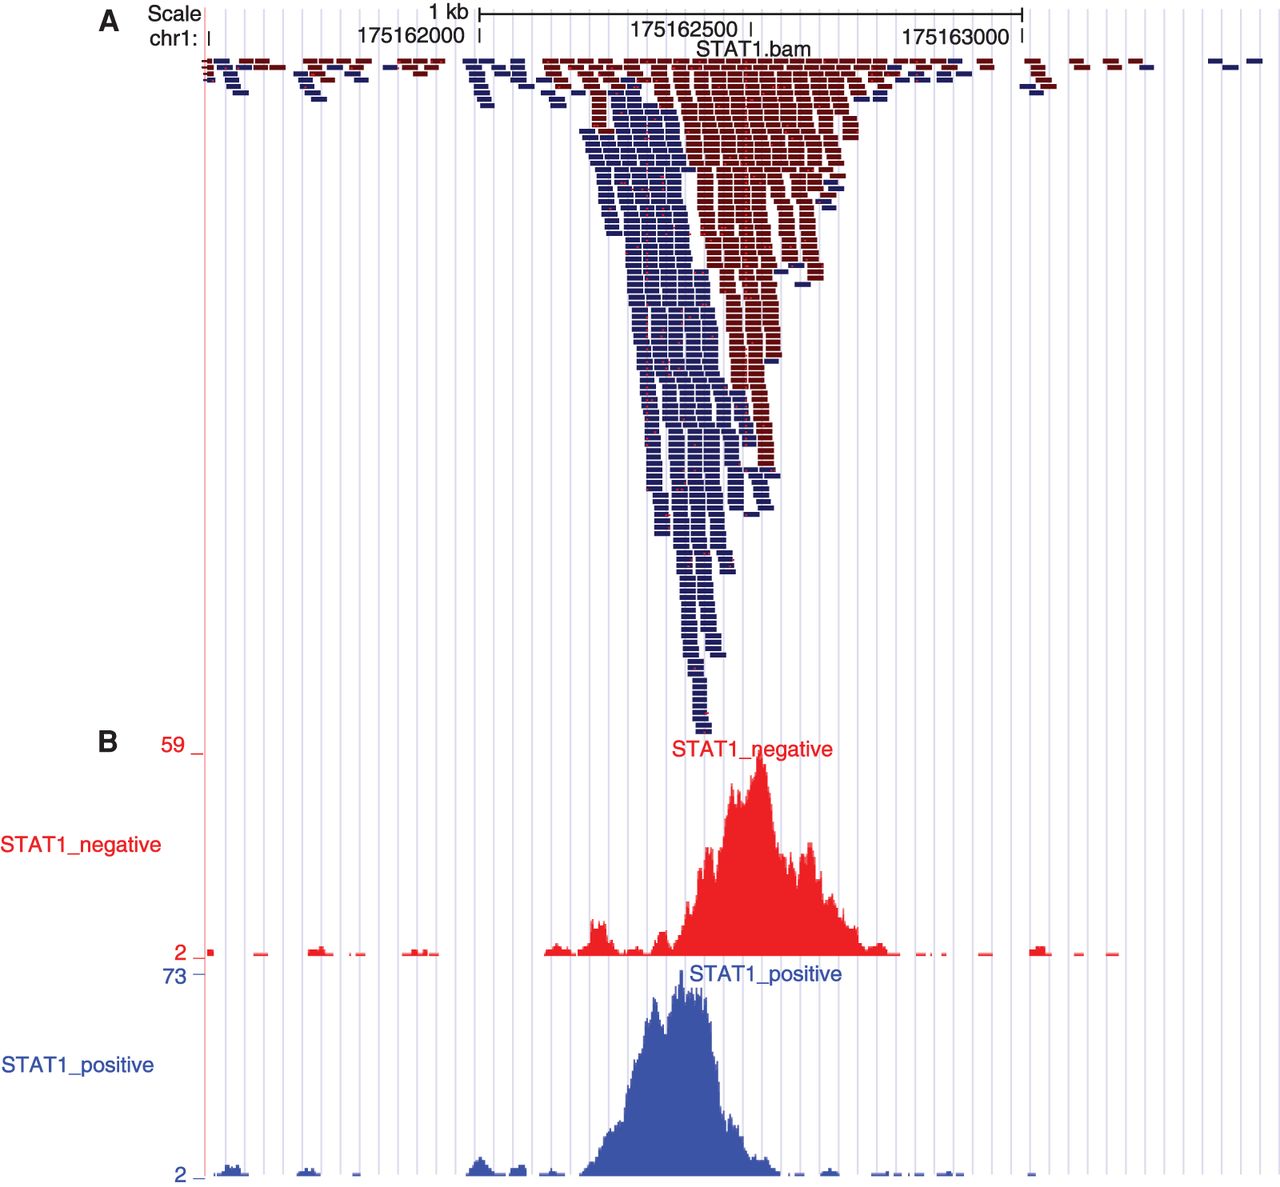
Figure 2.
Visualizing the Bowtie alignments on the UCSC Genome Browser. (A) The uploaded STAT1.bam file. By setting the zoom to the base level, mismatches in each read will become visible. (B) Two custom tracks uploaded to the UCSC Genome Browser. Leftmost labels indicate the names of the tracks.