
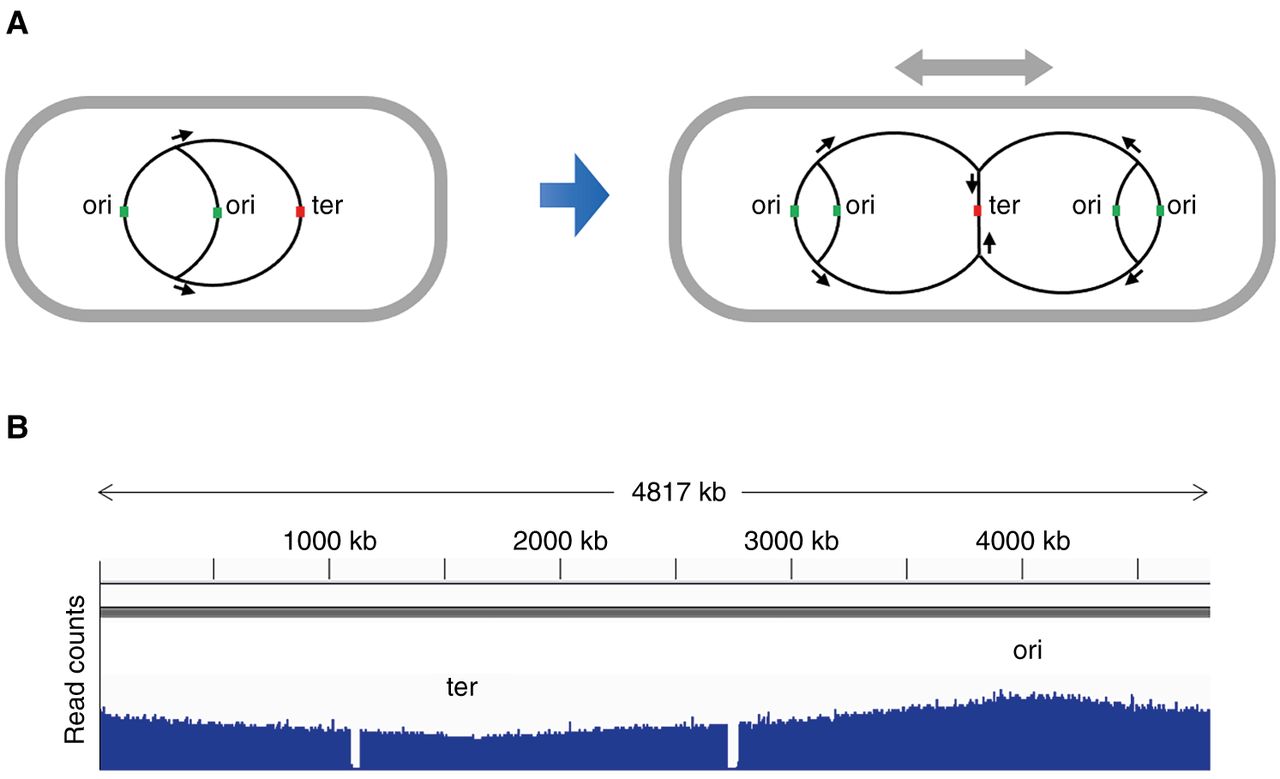
Figure 1.
Gene-dosage gradient in bacterial DNA replication. (A) Schematic diagram of the replicating chromosome during cell growth. (B) Read-count profile of randomly fragmented chromosomal DNA from exponentially growing Salmonella in a high-throughput DNA-sequencing experiment. (The two gaps in the profile correspond to the locations of two prophages missing in the strain used here.)


