
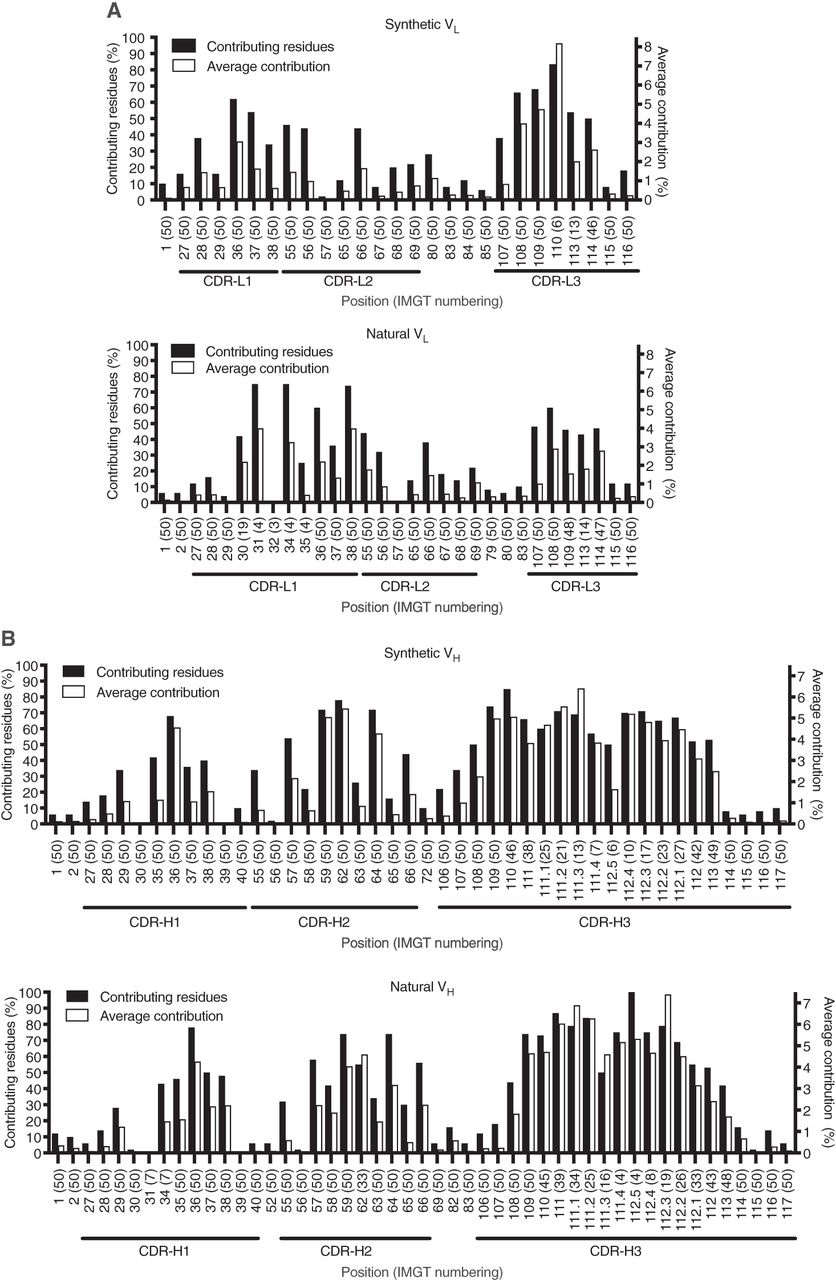
Relative contributions of antibody (Ab) residues to the structural paratope for the analyzed synthetic and natural Abs. Data are plotted for light-chain variable (VL) domains (A) and heavy-chain variable (VH) domains (B). At each position (x-axis), the black bars (left y-axis) show the percentage of contributing residues (contributing residues %), and the white bars (right y-axis) show average relative contribution to binding interface (average contribution %). The contributing residue percentage was calculated by dividing the number of structures with ≥0.5% relative contribution to the structural paratope at position X by the total number of structures available for position X. Average contribution percentage was obtained by calculating relative contribution to the structural paratope at position X for each structure and then averaging these values. Note that the relative contribution values for each position are not normally distributed but follow a strong positive skew distribution, with a significant proportion of values being 0 and standard deviations exceeding the average values. Thus, the average values shown are not meant to represent the most observed values for a given position but rather provide some measure of comparison between synthetic and natural data sets. Only positions with the contributing residues ≥5% and that have residues in ≥5% of structures are shown. Complementarity-determining regions (CDRs) are indicated and are defined as the continuous stretches of amino acids containing positions that contribute to the structural paratope in ≥5% of structures analyzed. The total number of structures that contain a residue at a given position is indicated in parentheses. Positions are numbered according to the IMGT nomenclature (Lefranc et al. 2003).


