
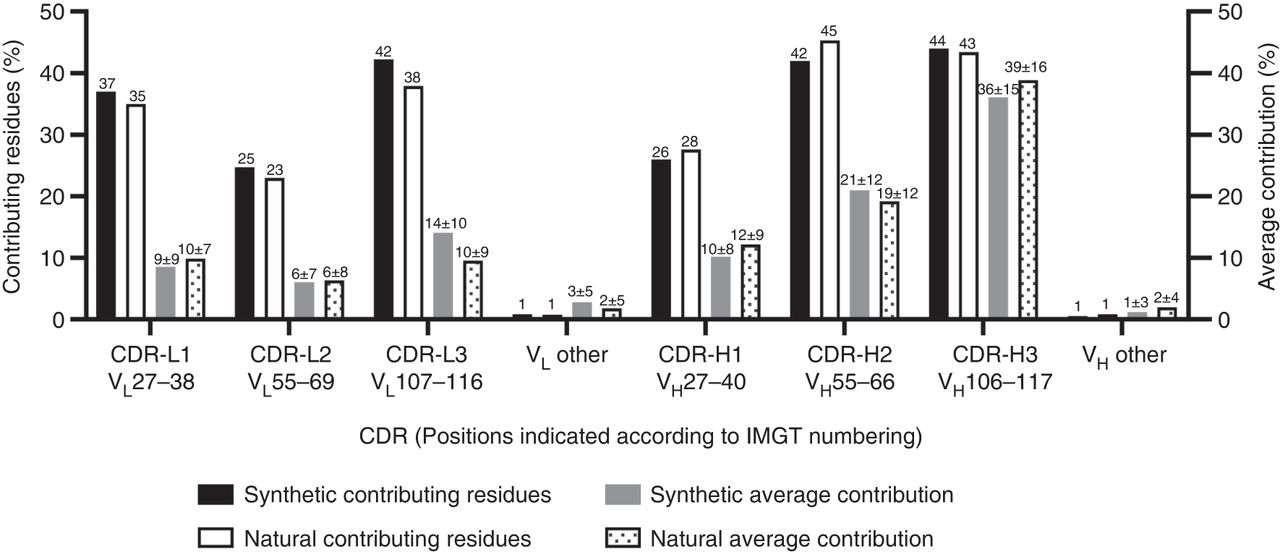
Relative contributions of complementarity-determining regions (CDRs) to the structural paratope for the analyzed synthetic and natural antibodies (Abs). The CDRs were defined based on the analysis described in Figure 2, and the positions assigned to each CDR are indicated on the x-axis. For each CDR (x-axis), the black bars (left y-axis) show the percentage of contributing residues (contributing residues %), and the white bars (right y-axis) show average relative contribution to the structural paratope (average contribution %). The contributing residue percentage was obtained by calculating the total number of residues with ≥0.5% relative contribution to the structural paratope within a given CDR in the 50 structures and dividing it by total number of residues within the same CDR in the 50 structures (values are shown above the bars for clarity). The average contribution percentage was obtained by calculating relative contribution of a given CDR to the structural paratope in each structure and then taking an average over 50 structures. The values of averages ± standard deviation are shown above the bars. Note that large standard deviations are reflective of strong positive skew of the distribution, where the majority of values are lower than the average and even include some 0 values. The same analysis was performed for all positions outside the CDRs, which were grouped as light-chain variable (VL) other and heavy-chain variable (VH) other for VL and VH domains, respectively.


