
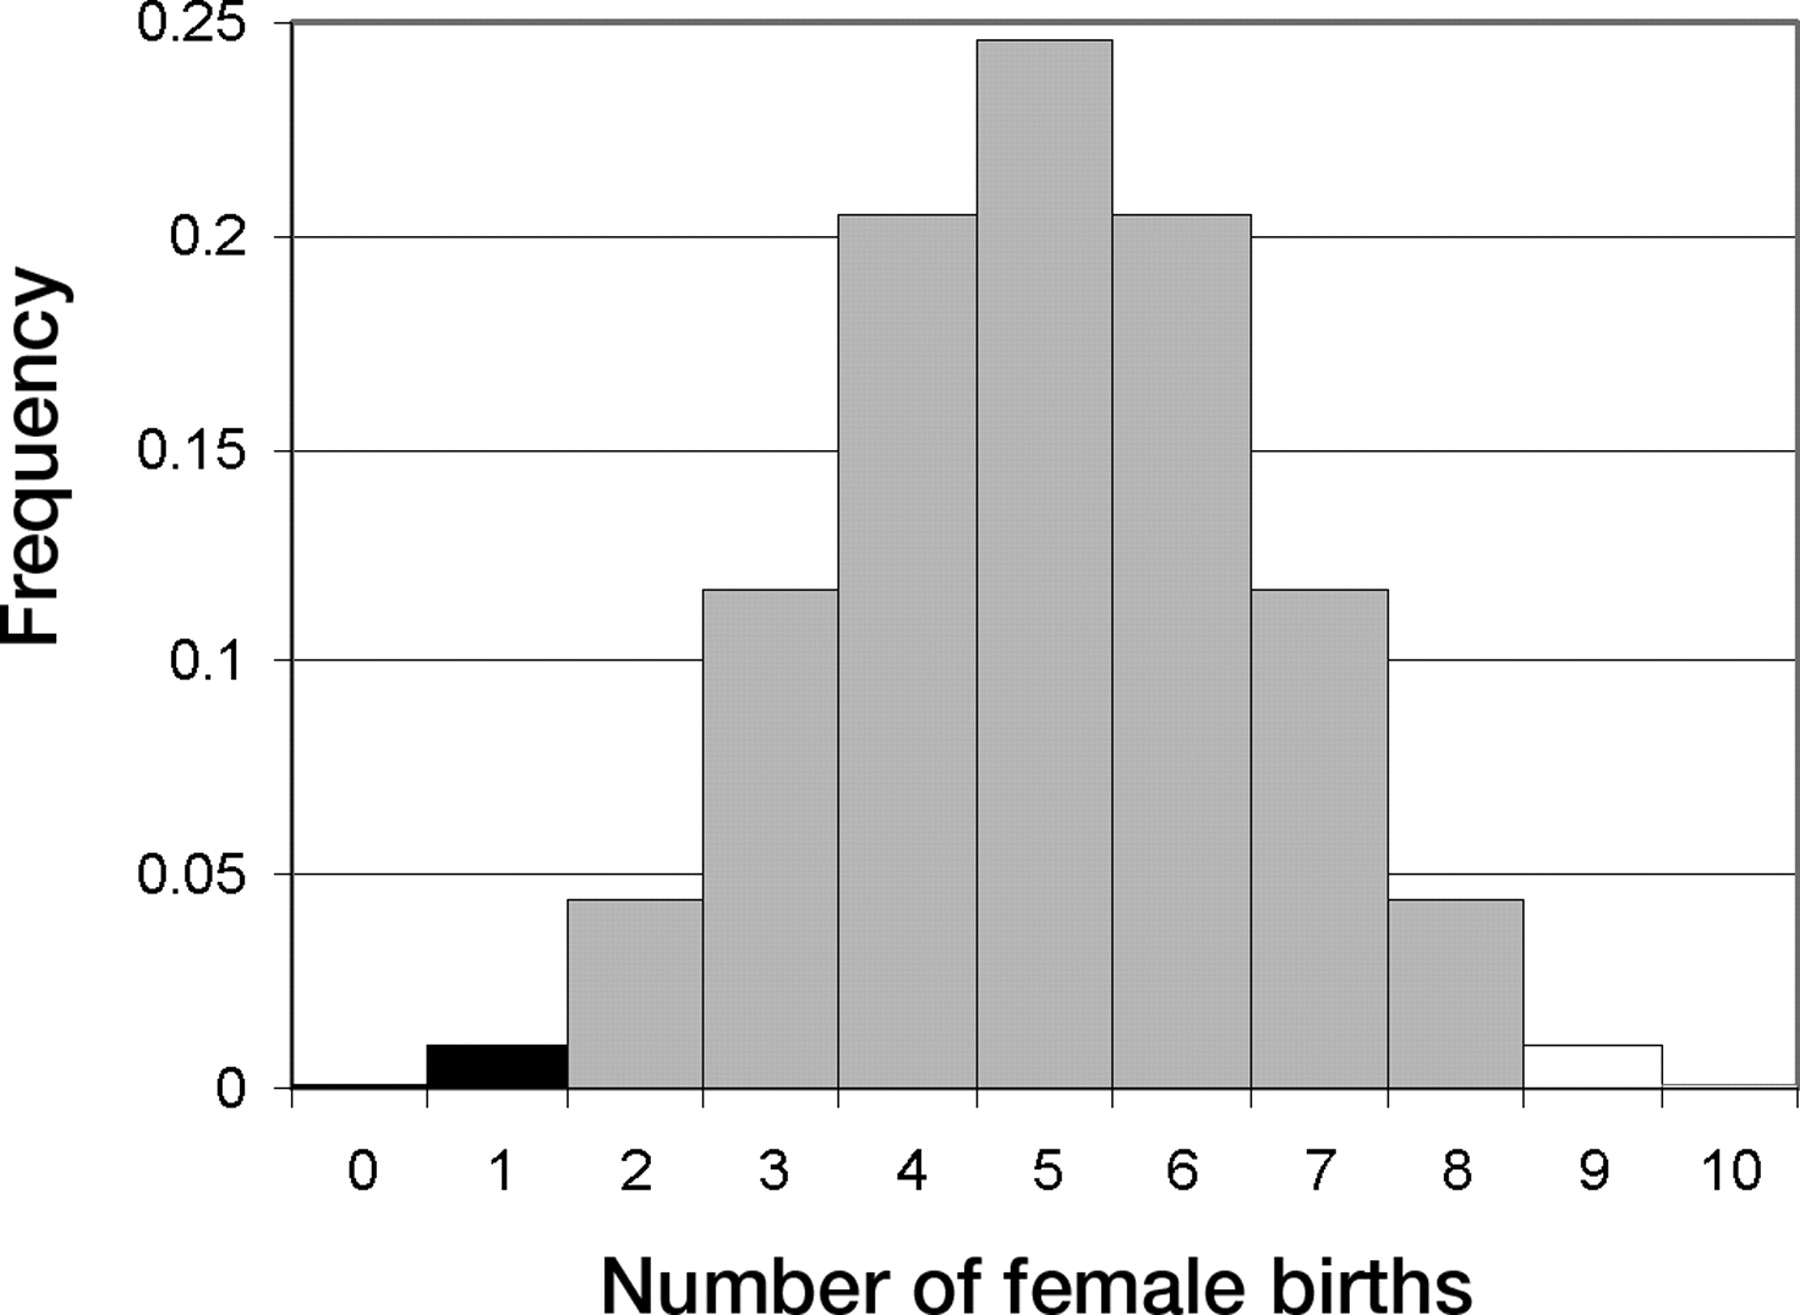
Figure 4.
Example of a binomial density and a graphical depiction of a one-sided p value and a two-sided p value. The density is binomial with p = 1/2. The x axis denotes the number of births. There can be 0 to 10 births. Although difficult to see in the graph for the values 0 and 10, each of the 11 possible outcomes has nonzero probability and is represented by a histogram block. The area defined by the black blocks at 0 and 1 represent the p value for the one-sided test. The area represented by the black blocks at 0 and 1 and the white blocks at 9 and 10 represent the p value for the two-sided test.


