
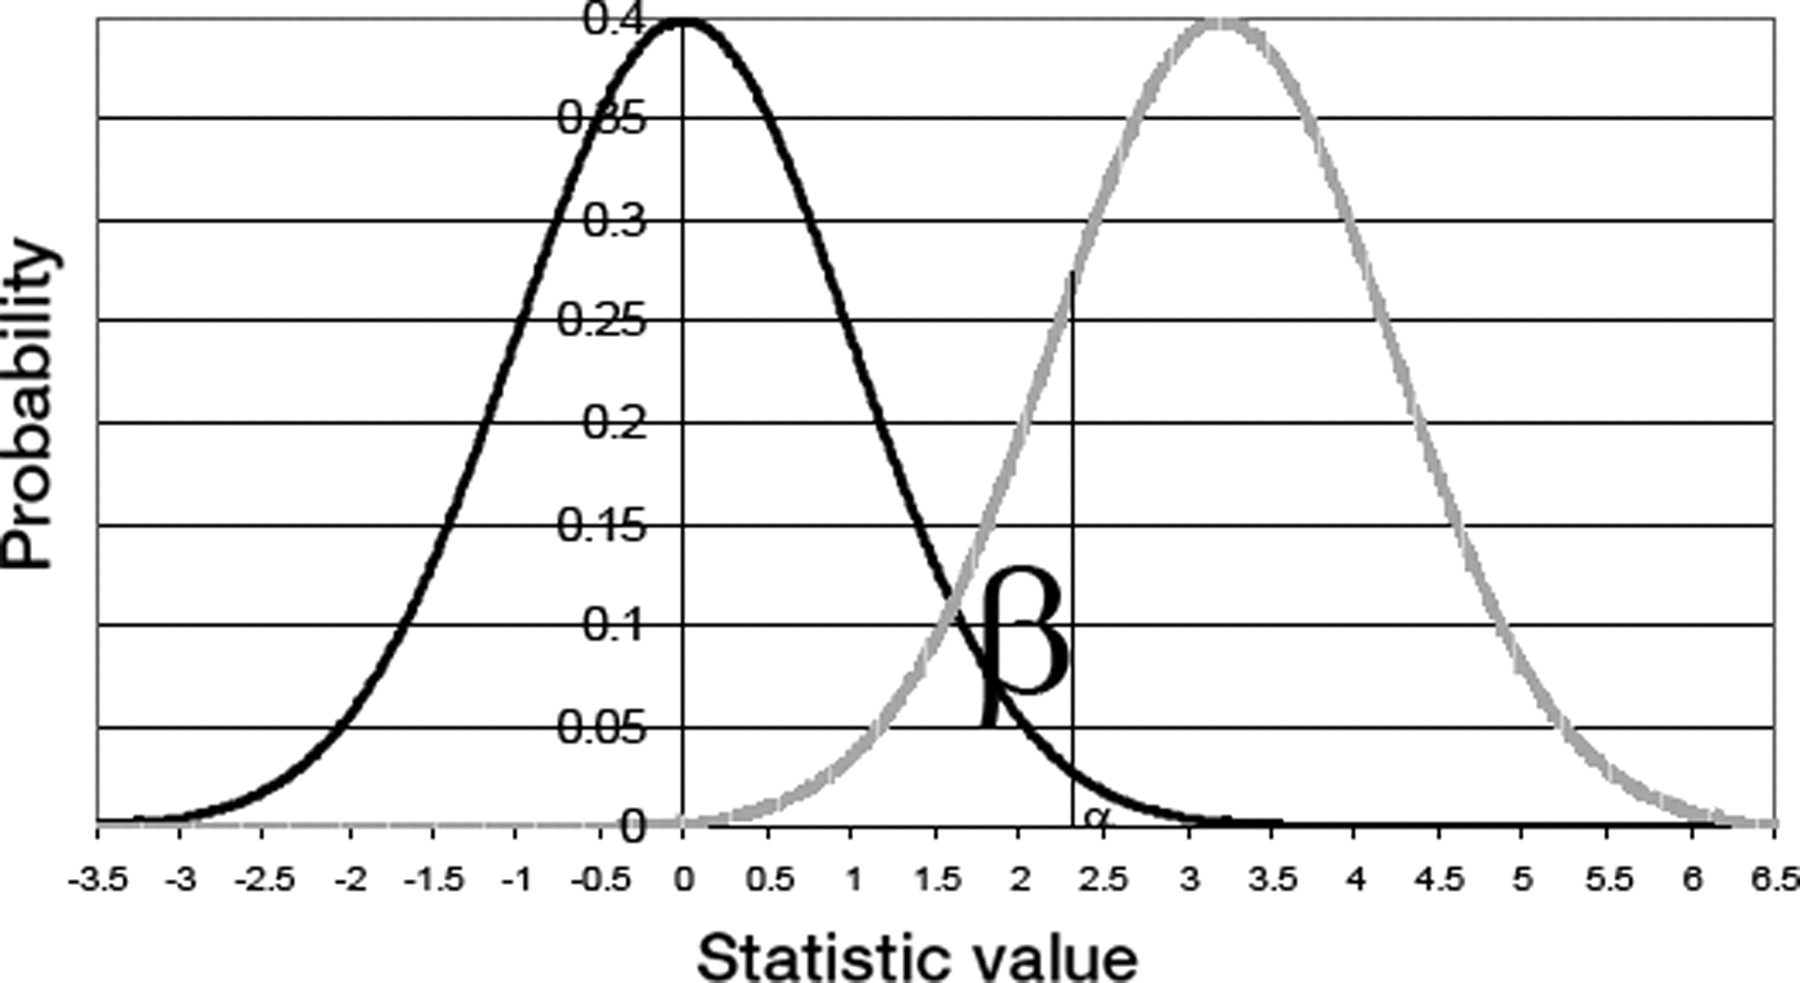
Figure 5.
Graphical depiction of the null and alternative densities. The black curve represents density under the null hypothesis and the gray curve represents the density under the alternative hypothesis. The vertical line at 2.32 marks the boundary of the one-sided significance level (α = 0.01, area to the right of the line under the null density curve) and the type II error (β = 0.19, area to the left of the line under the alternative density curve). The power is 0.81.


