
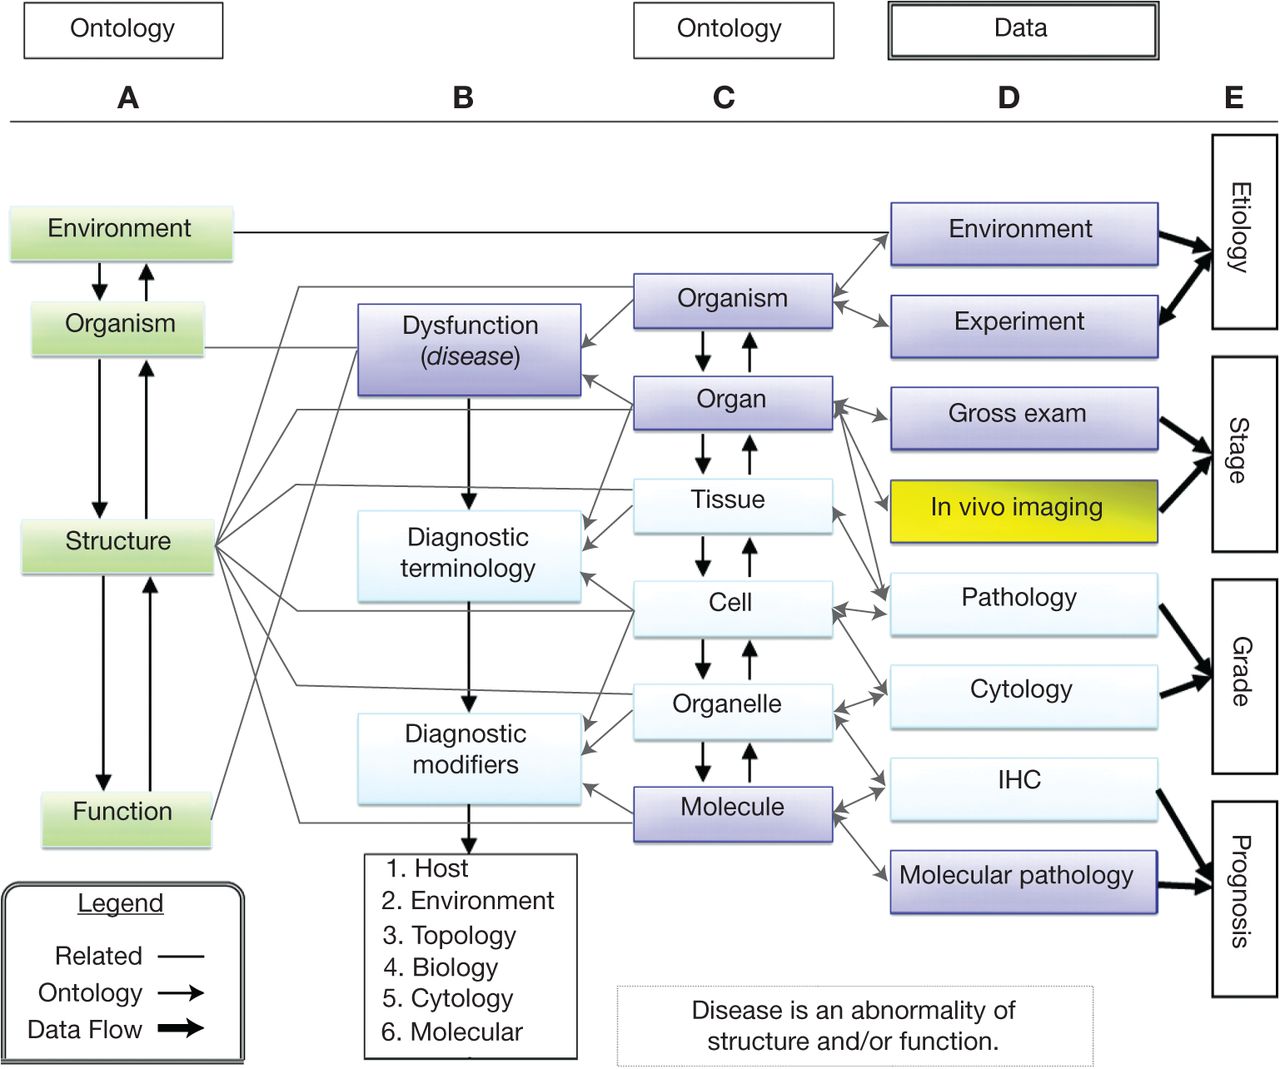
The ontogeny of disease. This ontology illustrates the complex relationships among structure, function, data sources, and diagnostic terminology (words used in diagnosis). It is based on the Rosse Foundational Anatomy ontology (Rosse and Mejino 2003; Cardiff et al. 2004). It shows the information required to understand microscopic pathology within the context of disease. The ontological structure provides an organ-based hierarchy with levels of anatomic organization to describe structure. The color in the boxes indicates the sources of the information: investigators (violet), imagers (yellow), and pathologists (light blue). Column A emphasizes normal relationships between organism, structure, and function. Column B demonstrates the relationship between the levels of organization and diagnostic nomenclature. Information is gathered from many levels of structure and function (column C). The pathologist's interpretation of the structure integrates all of the clinical, functional, and structural information (column D). Column E indicates the level of information used to decide the different clinical features of tumors in human medicine. The connecting lines indicate the relationships and flow of information (data) that provide context for the “diagnosis.” The diagnosis is primarily descriptive and adheres to standard terminology. However, as pathologists integrate more sophisticated data sources, the data must be recorded as “diagnostic modifiers.” If pathologists and scientists will adhere to this, or similar, ontology, computers and informatics will enable the scientific community to organize their data sets and recognize the relationships (“map”) across species. Investigators and pathologists will need to recognize and understand their roles in the organizational scheme to share data sources. This is our challenge and our responsibility.


