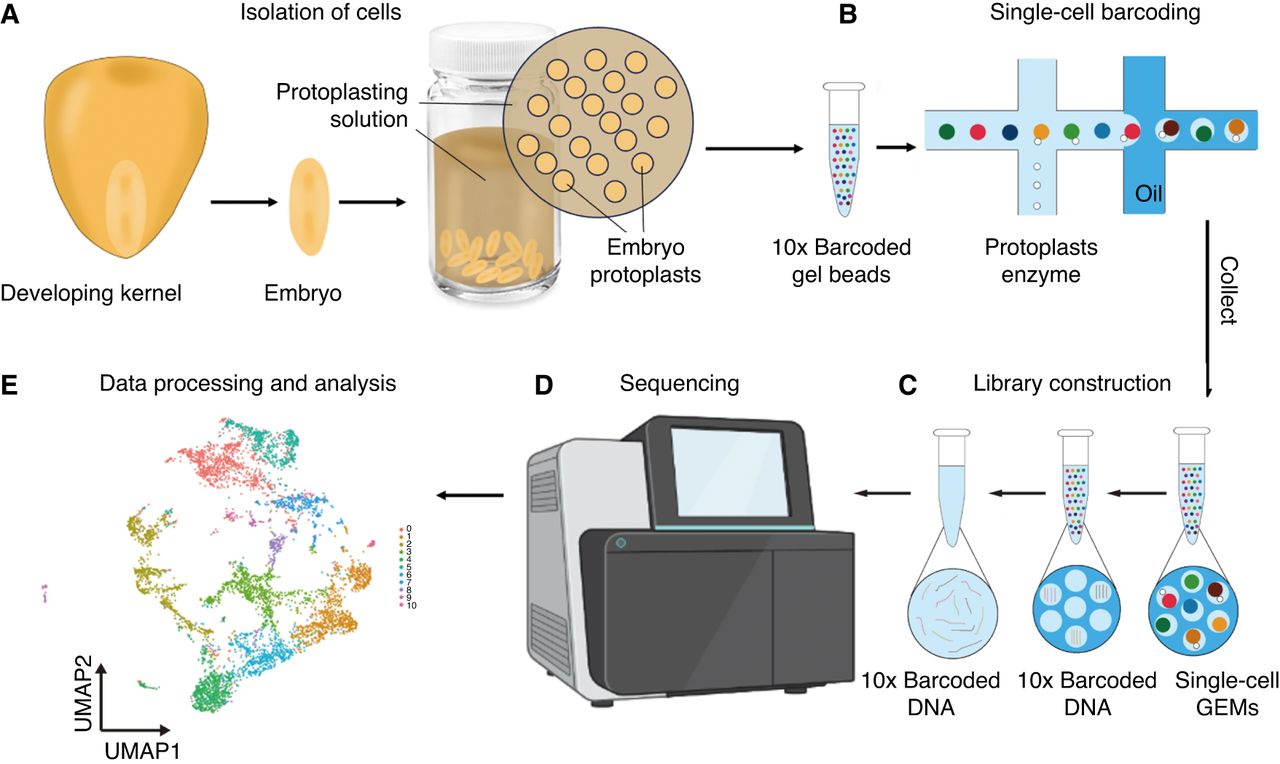
A flow chart for performing single-cell transcriptomic analysis. (A) Maize embryos are dissected from developing kernels. Cell walls are digested in digesting solution, followed by isolation of the resulting protoplasts. (B) Protoplasts are mixed with 10x barcoded gel beads and embedded in oil, forming a Gel Bead-In-EMulsion (GEM). (C) Single-cell GEMs are collected; cDNA is synthesized through reverse transcription (RT). cDNA strands are then pooled, followed by oil removal. The cDNA molecules are amplified for library construction. (D) The cDNA library is sent to be sequenced. (E) The read data are processed for subsequent analyses. The example graph shows a uniform manifold approximation and projection (UMAP) layout with 11 cell clusters (clusters 0–10 coded by different colors). Steps B and C are adapted from the 10x Genomics User Guide: CG000732 (10x Genomics, Inc. 2024a). Images courtesy of 10x Genomics, Inc.