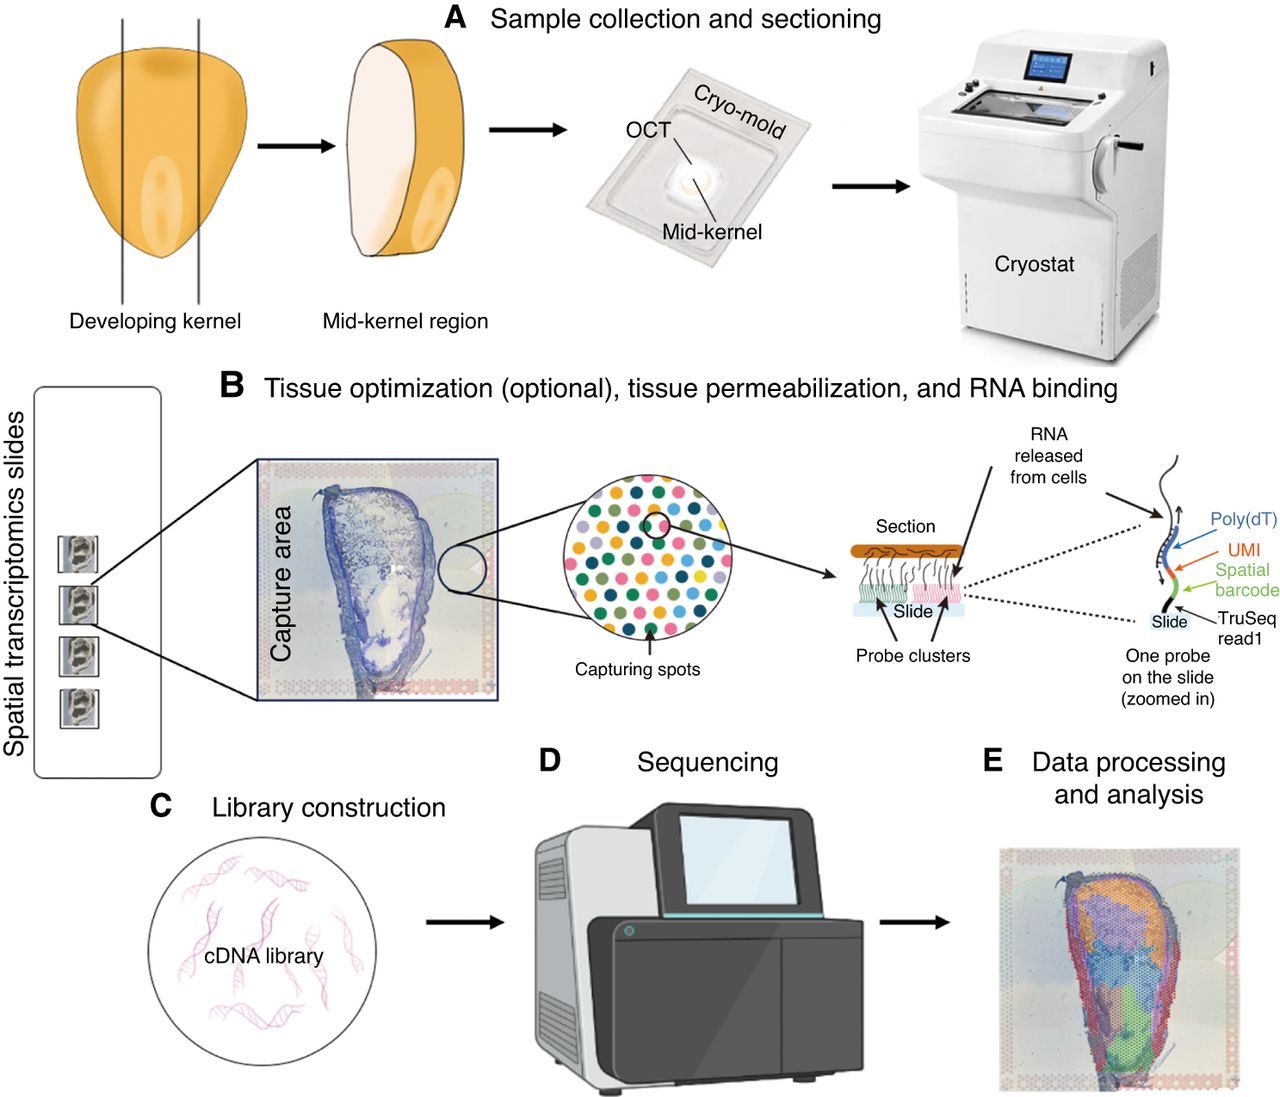
A flow chart for performing spatial transcriptomic analysis. (A) The developing maize kernel is cut longitudinally, and the mid-kernel region containing the embryo is retained. The mid-kernel region is fresh-frozen in optimal cutting temperature (OCT) and sectioned using a cryostat. (B) Tissue sections are mounted on the capture areas of spatial transcriptomic slides. During tissue permeabilization, RNA is released from the section and binds to probes on capture spots. Universal poly(dT) probes contain spatial barcode information and unique molecular identifiers (UMIs). When processing a tissue or organ for the first time, we highly recommend performing a tissue optimization step to determine the optimal permeabilization time. If the permeabilization time is too short, the tissue remains intact, leading to incomplete RNA release, resulting in low transcript detection and poor gene expression signals, while if too long, it may cause RNA diffusion, leading to mislocalization of transcripts and reduced spatial specificity. (C) First-strand cDNA is synthesized via reverse transcription (RT), followed by second-strand cDNA synthesis. The double-stranded cDNA molecules are then released from the slides and undergo amplification for library construction. (D) The cDNA library is sent to be sequenced. (E) The read data are processed and mapped to the sections based on the spatial barcode. Step B is adapted from the Visium Spatial Gene Expression User Guide CG000239 (10x Genomics, Inc. 2024b). Images courtesy of 10x Genomics, Inc.